Back
mg
mysterious guy • 8m
The 6 Hidden Numbers That Predict Startup Success Every startup founder lives and breathes metrics. But here's a secret: most of us are tracking the wrong ones. We get bogged down in vanity numbers, compare ourselves to competitors, and drown in data that ultimately tells us nothing about future success. After diving deep into data from countless pre-revenue startups, from early-stage ventures to those in top accelerators like Y Combinator, a powerful pattern emerged. Forget the traditional business metrics for now—they're irrelevant when you're just starting out. Instead, focus on these six crucial numbers that truly predict whether your startup will thrive or die. Why Traditional Metrics Fail Early Startups Before revenue hits, traditional metrics are meaningless. User numbers are too small to be significant, growth rates are wild and unreliable, and customer acquisition costs are still a mystery. The real insights lie in metrics that don't look like typical business figures at all. The 6 Metrics That Actually Matter 1. Problem Resolution Rate (PRR) What it is: The percentage of target users who confirm your solution actually fixes their problem. Why it's vital: This is the ultimate predictor of future product-market fit. Our analysis shows startups with an 80%+ PRR are 3x more likely to generate significant revenue within 18 months. How to track: Survey early users, conduct problem interviews, and analyze usage patterns. Target: Aim for over 80% before scaling. 2. User Return Rate (URR) What it is: The percentage of users who return to your product within 7 days of their first use. Why it's vital: Early retention is everything. Startups with a 40%+ week-one return rate are 2.5x more likely to achieve product-market fit. Watch out for single-use behavior or declining engagement! Target: Over 40% seven-day return rate. 3. Problem Frequency Score (PFS) What it is: How often your target users encounter the problem you're solving. Why it's vital: This predicts market size and urgency. Problems users face daily create businesses 4x more valuable than those encountered monthly. How to score: * Daily = 5 points * Weekly = 3 points * Monthly = 1 point * Less often = 0 points Target: An average score of 3+ across your user base. 4. Organic Sharing Coefficient (OSC) What it is: The percentage of users who voluntarily share or recommend your product without being asked. Why it's vital: This is the earliest sign of viral potential. Startups with an OSC over 30% secured successful Series A rounds 2.7x more often. How to calculate: (Unprompted Referrals / Total Users) x 100 Target: Over 30% for consumer products, 20%+ for B2B. 5. Problem-Solution Gap (PSG) What it is: The difference between how important users say the problem is (1-10) and their satisfaction with current solutions (1-10). Why it's vital: This predicts willingness to pay. A gap of 4+ points correlates with 3x higher conversion rates at launch. How to calculate: Problem Importance - Current Solution Satisfaction Target: A gap of 4+ points. 6. Time-to-Aha Moment (TTAM) What it is: How long it takes new users to experience the core value of your product. Why it's vital: A quick "aha!" moment drives both viral growth and retention. Products with a TTAM under 3 minutes saw 5x higher user growth rates. How to track: User session recordings, feature activation timing, and feedback interviews. Target: Under 3 minutes for consumer products, under 1 hour for B2B. Put These Metrics to Work * Set Up Tracking: Use tools like Mixpanel or Amplitude, create simple feedback forms, and conduct regular user interviews. * Build a Dashboard: Track all six metrics weekly, look for trends, and set alerts. * Act on the Data: Prioritize improvements based on your weakest metrics, test changes systematically, and iterate constantly. Forget vanity metrics like total signups or social media followers for now. These six metrics are your North Star for pre-revenue success. Start incorporating traditional business metrics only when you're generating revenue, have over 1,000 active users, achieve product-market fit, or are raising significant funding. The best metrics don't just tell you what's happening—they tell you what's going to happen. What hidden metrics are you tracking in your startup?

Replies (1)
More like this
Recommendations from Medial
Nikhil Sinha
Software Engineer | ... • 4m
🗓️ Day 2/7 - Problem hunting mode Digging deep into user pain points instead of just coding features. Found something interesting: Users complain about productivity apps but rarely switch. The real question: Am I solving a problem people desperat
See MoreAtharva Deshmukh
Daily Learnings... • 1y
User Research 1] User Personas 2] User Interviews 3] Surveys and Questionnaire 4] Ethnographic Research PM's primary goal is to provide its users with what they want, something they'll want to keep coming back. Various research methods are used to
See MoreAjayEdupuganti
I like software and ... • 1y
Hi How does a loyalty points aggregator platform sound like? Wherever the user buys. If that is a partnered app. The loyalty points will be shown in the app. And that alone or + offers will give an incentive for the users to shop with them again aga
See MoreAmbar Bhusari
UX Designer for User... • 1y
New Users are in! Now Let’s Talk Activation Metrics. The marketing team did an incredible job bringing in new users—great! But now, it's time to shift focus to activation. But first, let's clear up a common confusion between adoption and activation
See MoreVivek Joshi
Director & CEO @ Exc... • 9m
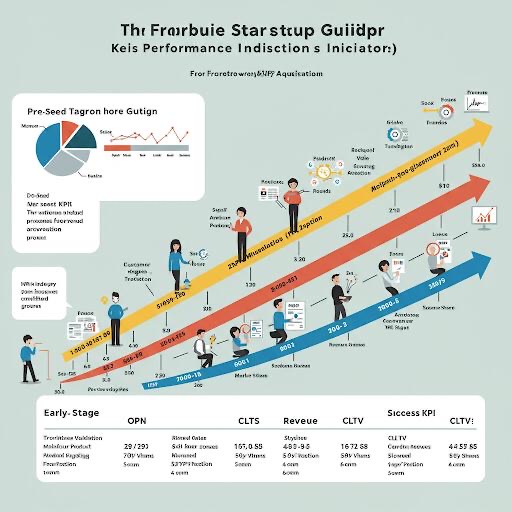
Crucial KPIs for founders, from inception to exit: Pre-Seed: Validate your idea! Focus on Problem-Solution Fit (qualitative user interviews, early sign-ups). Seed: Prove initial traction. Track Customer Acquisition Cost (CAC), Conversion Rates, and
See More
Nandha Reddy
Cyber Security | Blo... • 11m
Some mistakes I wish I knew before starting a project / startup/ idea :- Problem Statement – Clearly define the issue you're solving. Target Audience – Identify who benefits from your solution. Workflows – Map out how users will interact with your
See More
Download the medial app to read full posts, comements and news.


