
Back


SHEETAL SHARMA
Not an entrepreneur,... • 8m
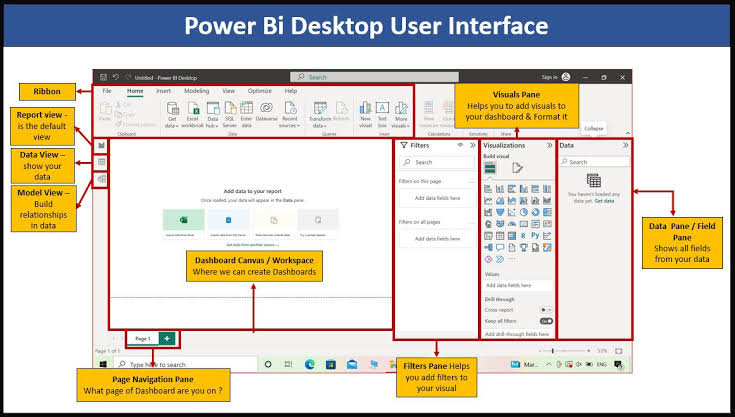
So , Power BI is a data visualization and business analytics tool by Microsoft. It helps you turn raw data into clear, interactive dashboards and reports. You can connect it with Excel, databases, and many other sources to make better decisions through visuals
More like this
Recommendations from Medial


Mohammad Rashid
Freelancer | Data & ... • 2m
For property investment and management businesses, Power BI dashboards track occupancy rates, rental income, expenses, ROI, and portfolio performance in real time. Excel automation handles rent calculations, arrears tracking, maintenance logs, and ca
See More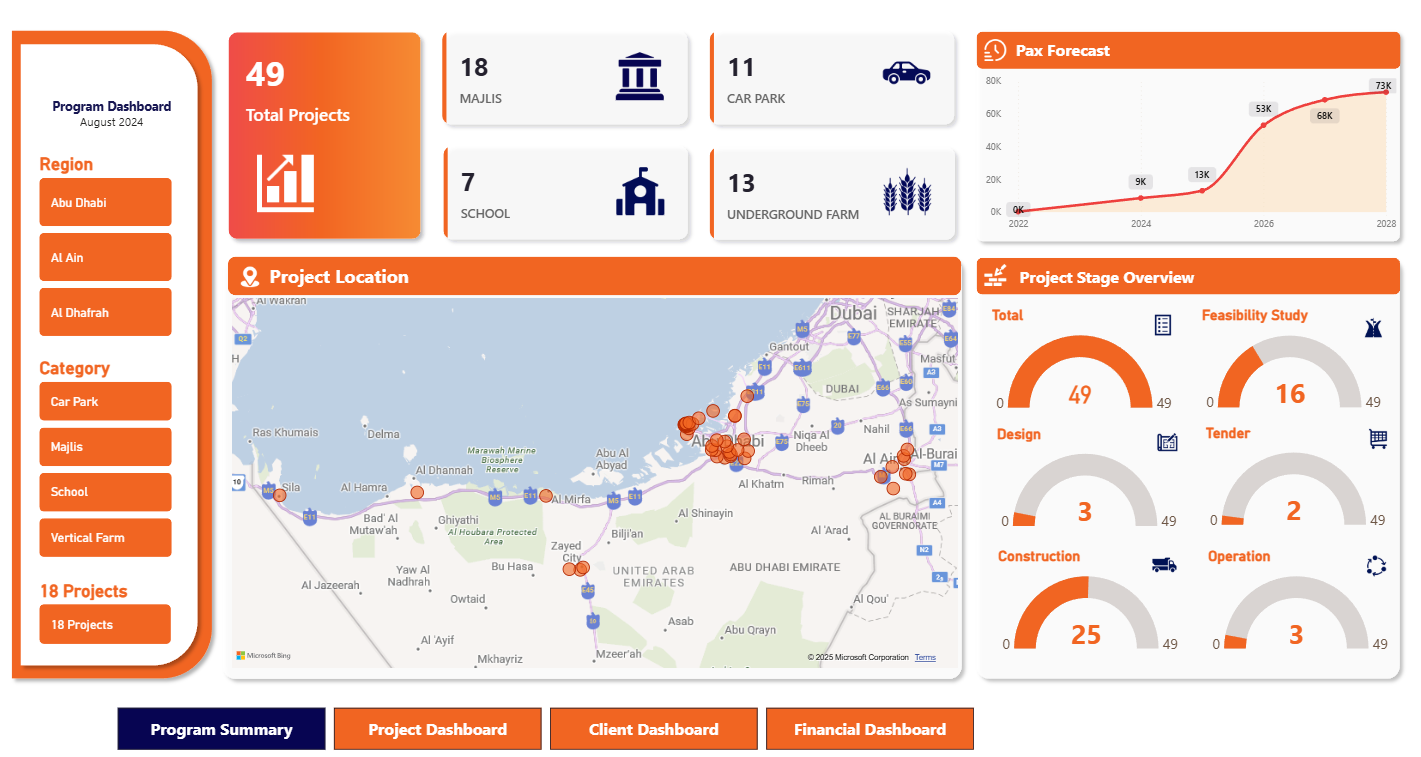


Shuvodip Ray
•
Arizona State University • 9m
Perplexity has launched Perplexity Labs, a new tool available to Pro subscribers that enables users to create reports, spreadsheets, dashboards, and interactive applications through features like AI-powered spreadsheet generation, interactive dashboa
See More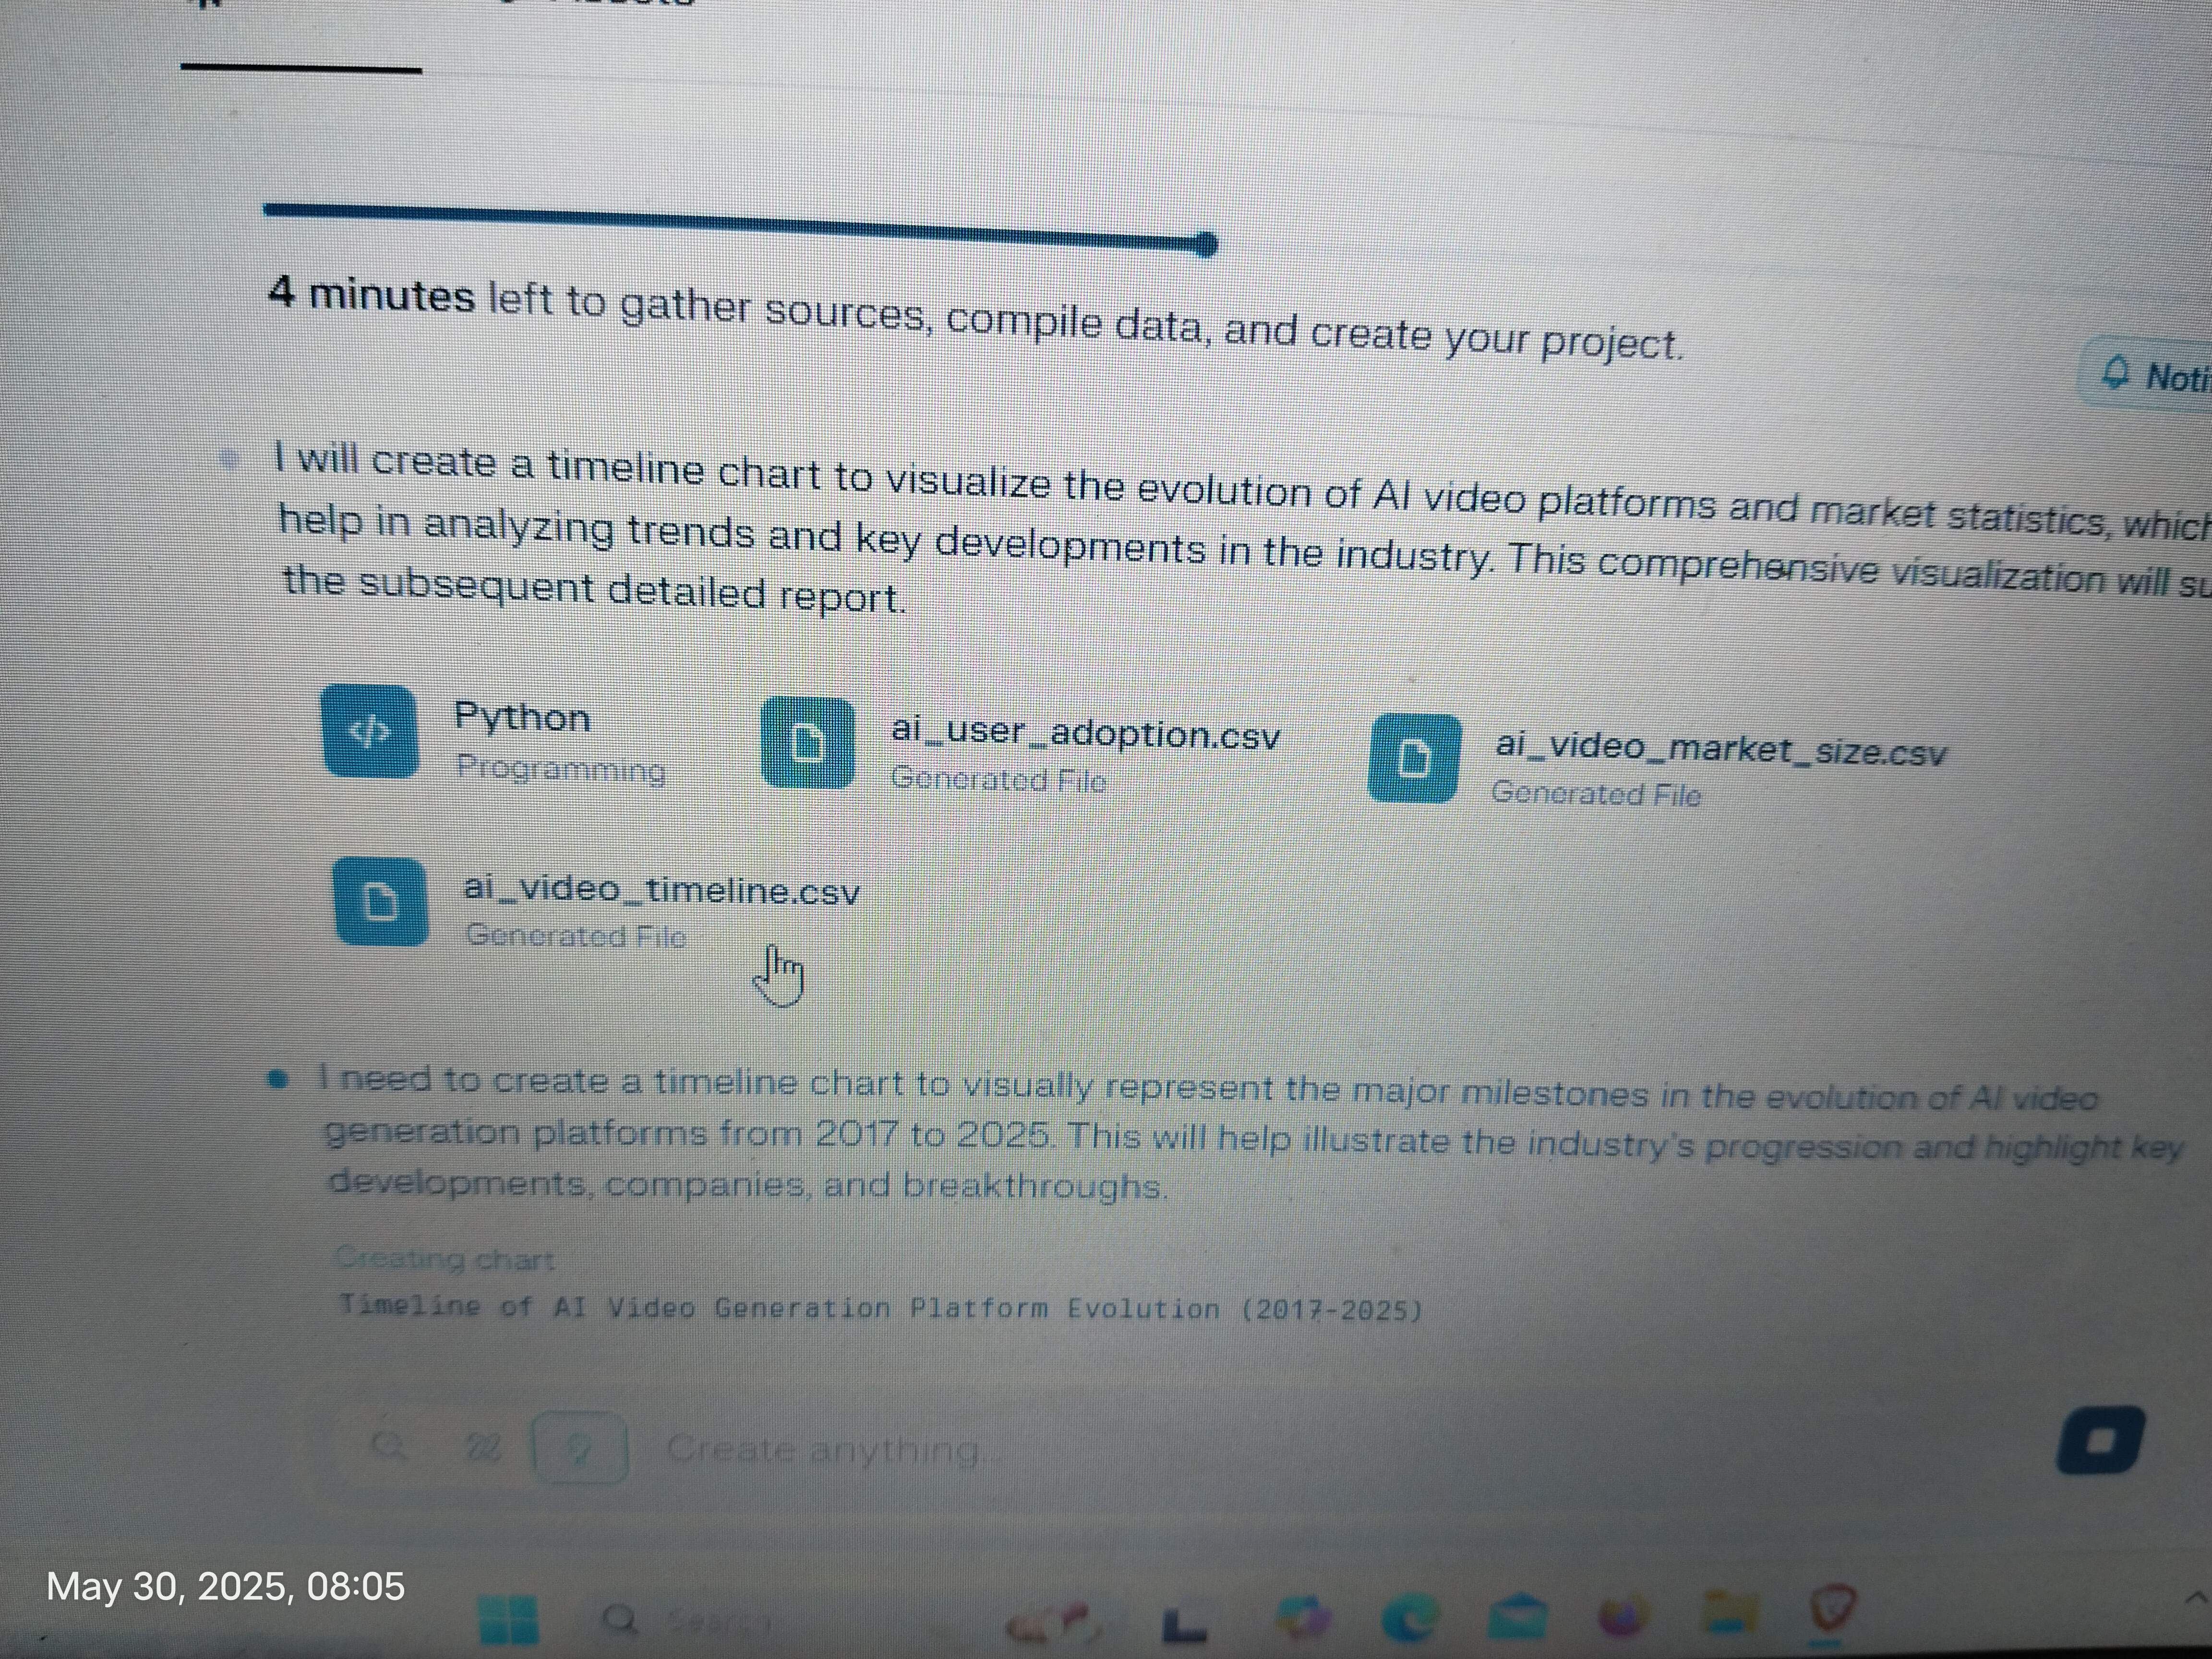

SHYAMALA IYER
Hey I am on Medial • 9m
Are you a startup trying to make sense of your data but don’t have the bandwidth or resources to build a powerful reporting system? I’m here to help you build interactive, scalable, and insightful dashboards in Power BI , tailored specifically for t
See More
Shubham Likhar
Dreams don't see wha... • 8m
Hi Everyone I'm a data analyst with 9 months of hands-on experience, skilled in Power BI, MySQL, Advanced Excel, and Tableau. I specialize in data visualization, statistical analysis, and reporting. I'm currently looking for a new opportunity in the
See More

Mohammad Rashid
Freelancer | Data & ... • 2m
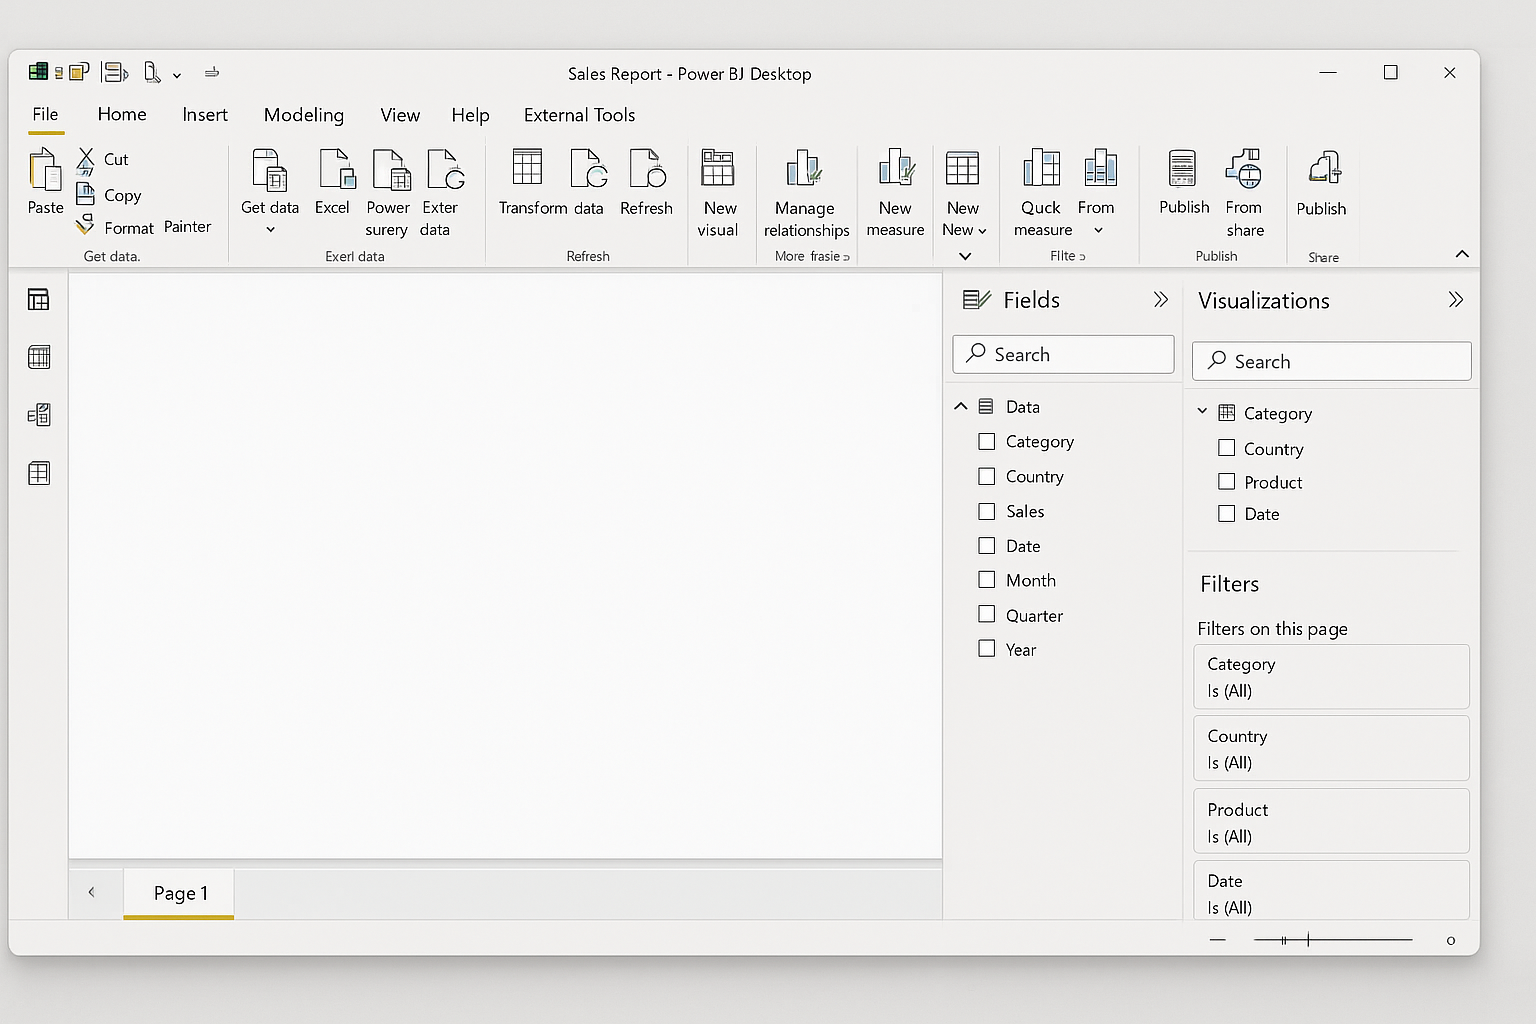
Building a Power BI dashboard is more than just creating visuals - it’s a structured process that turns raw data into actionable insights. Here are the 4 key stages of dashboard creation: 1️⃣ Loading & Transformation (Power Query) - Clean, shape, a
See More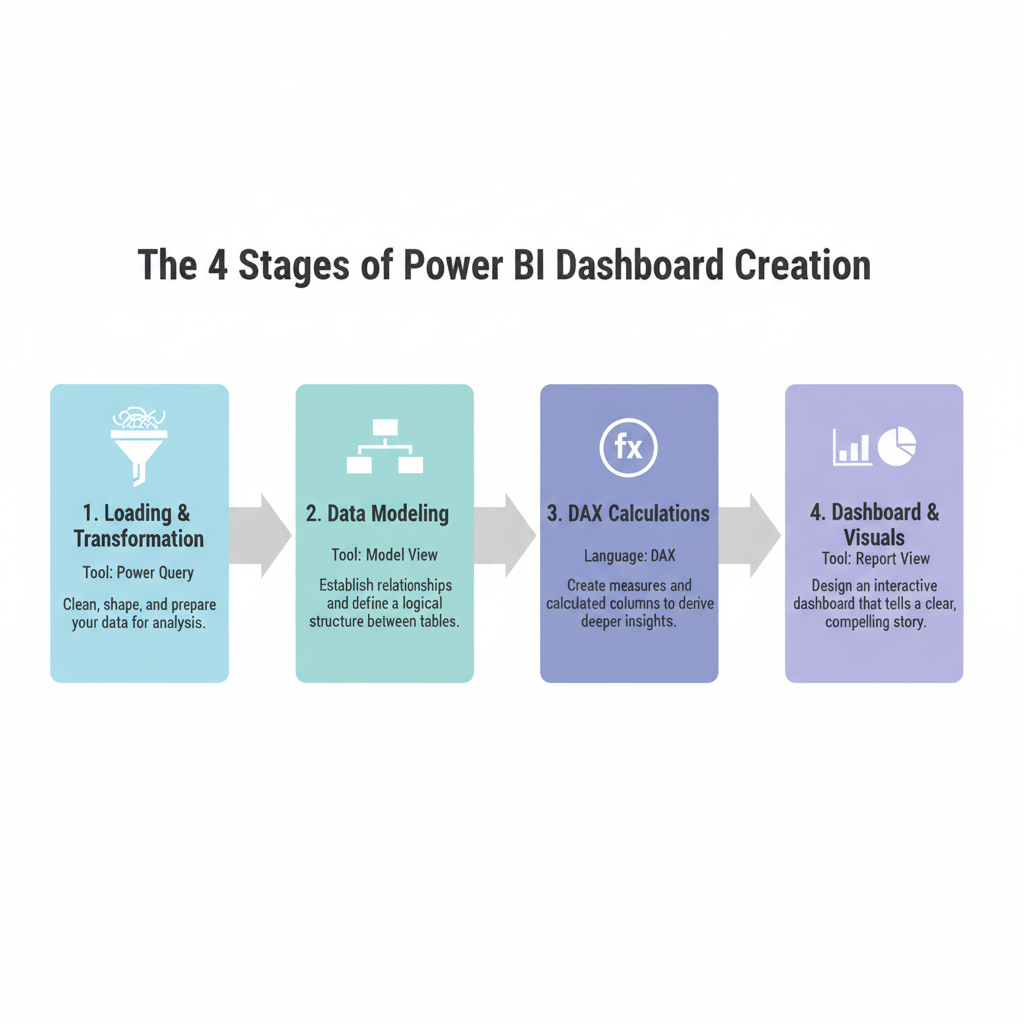

/entrackr/media/post_attachments/wp-content/uploads/2021/08/Accel-1.jpg)


Download the medial app to read full posts, comements and news.