
Back

Mohammad Rashid
Freelancer | Data & ... • 3m
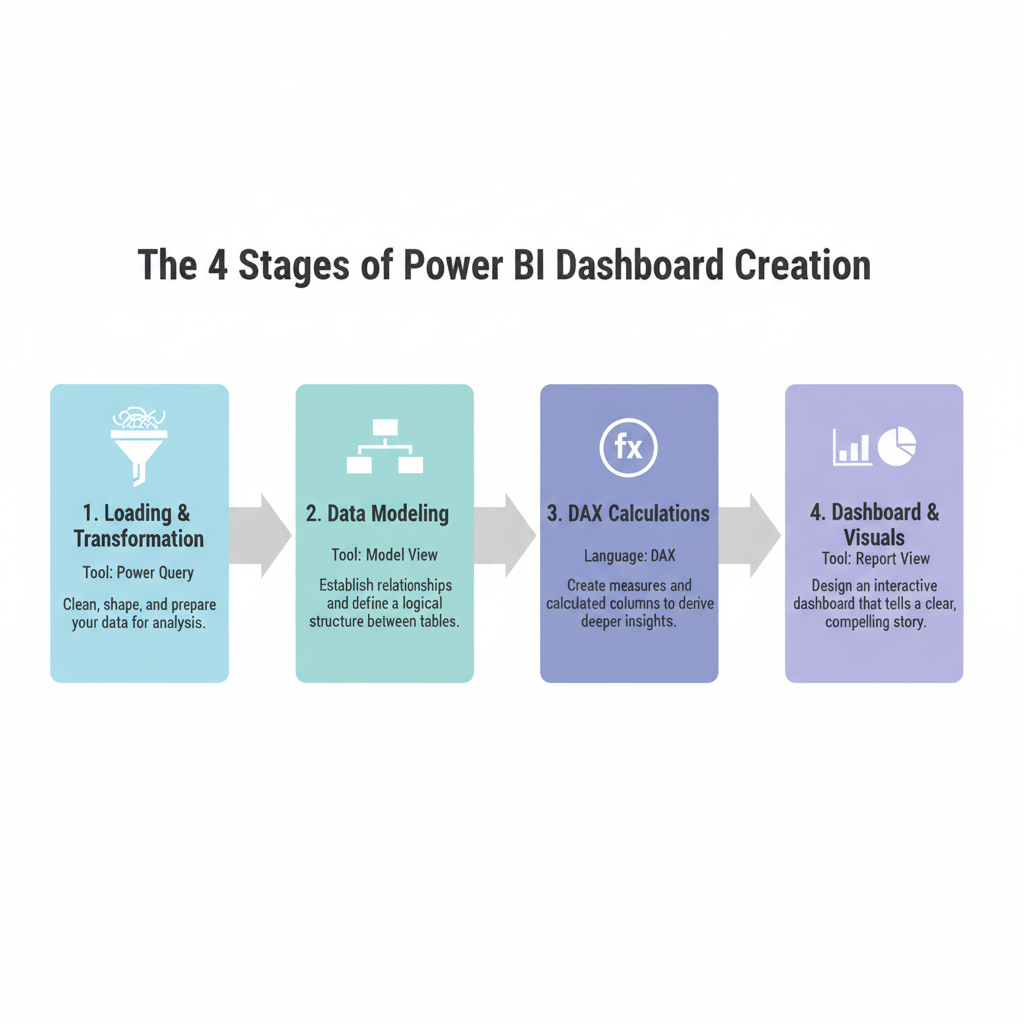
Building a Power BI dashboard is more than just creating visuals - it’s a structured process that turns raw data into actionable insights. Here are the 4 key stages of dashboard creation: 1️⃣ Loading & Transformation (Power Query) - Clean, shape, and prepare your data for analysis. 2️⃣ Data Modeling – Establish relationships and define a logical structure between tables. 3️⃣ DAX Calculations – Create measures and calculated columns to derive deeper insights. 4️⃣ Dashboard & Visuals – Design an interactive dashboard that tells a clear, compelling story.Master these four steps, and you’ll be able to transform any dataset into a powerful decision-making tool! Portfolio: rashidmohammad.netlify.app Fiverr: fiverr.com/mohammadrshid #powerbi #powerbidashboard #powerquery #datatransformation #datamodeling #DAX #Dashboard #Design
Replies (2)

More like this
Recommendations from Medial


Mohammad Rashid
Freelancer | Data & ... • 3m
For property investment and management businesses, Power BI dashboards track occupancy rates, rental income, expenses, ROI, and portfolio performance in real time. Excel automation handles rent calculations, arrears tracking, maintenance logs, and ca
See More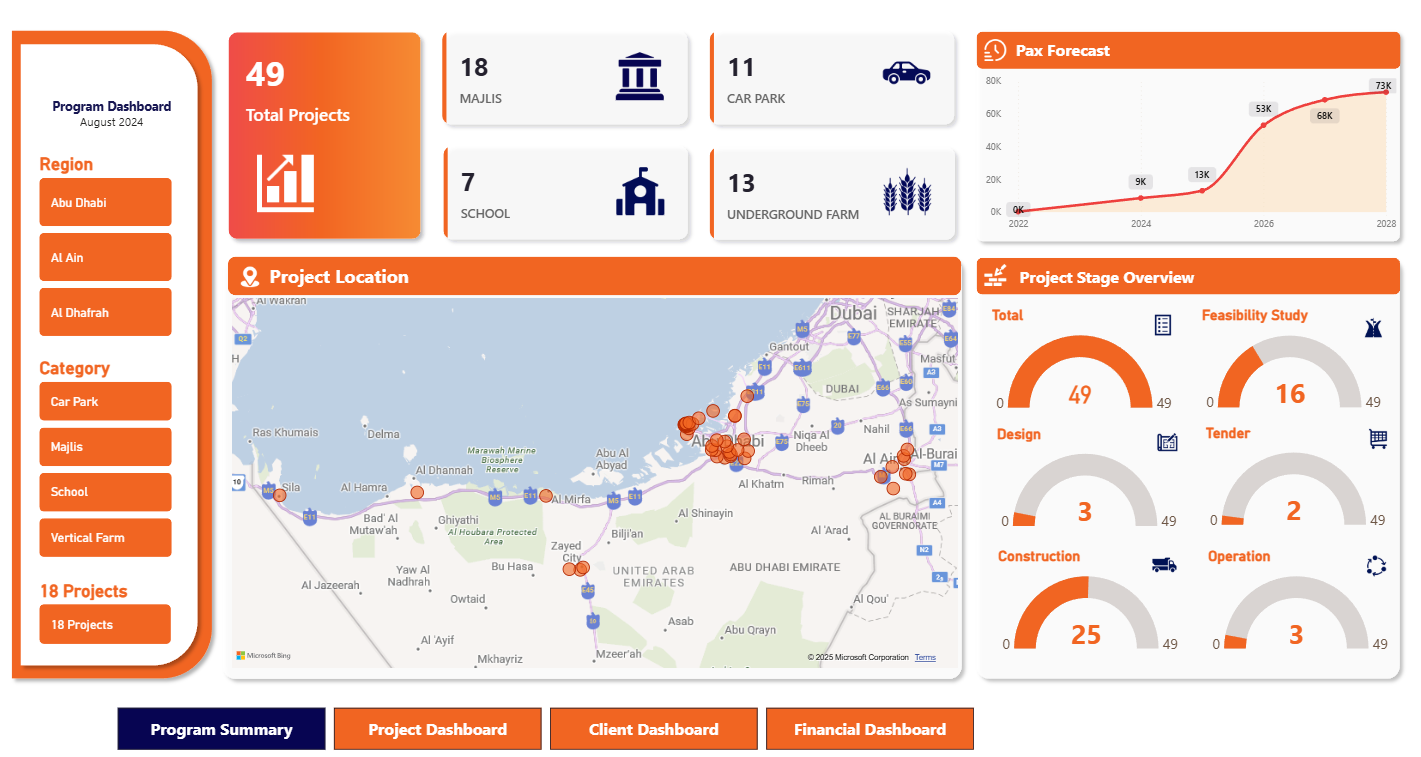

SHEETAL SHARMA
Not an entrepreneur,... • 8m
I’ve been thinking about starting my journey in the field of data analytics for a while now. And finally, I’ve decided to take the first step by learning Power BI — one of the most in-demand tools used in top companies. I’ve made a proper 7-day road
See More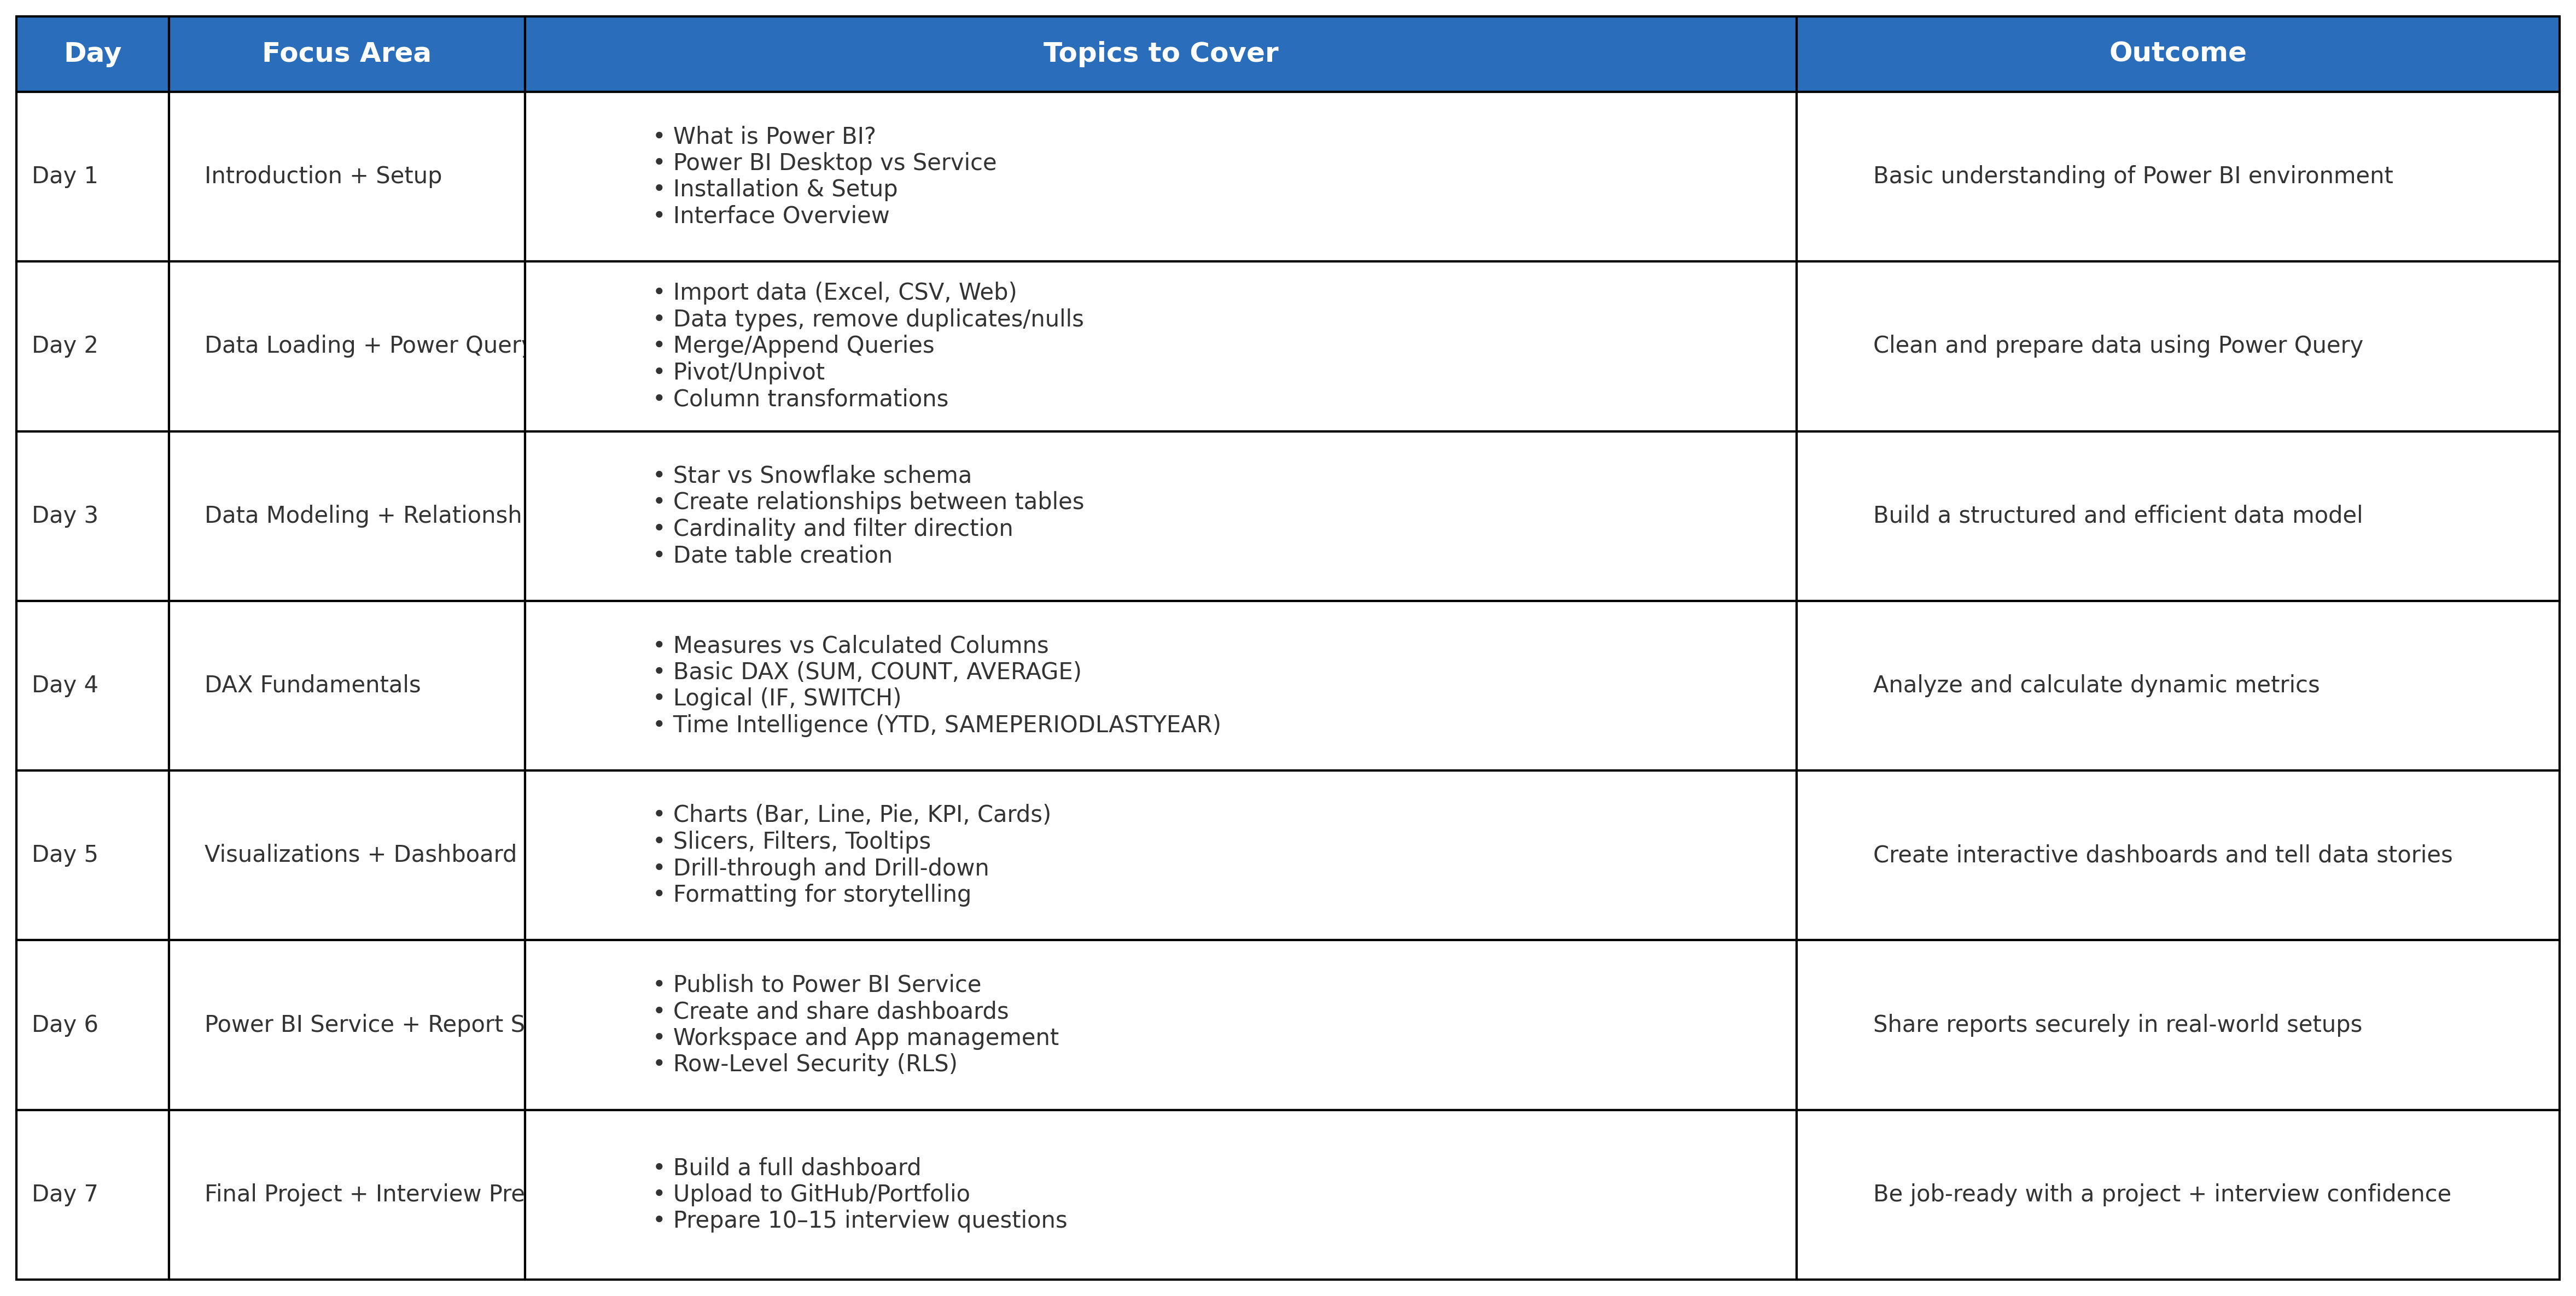

/entrackr/media/post_attachments/wp-content/uploads/2021/08/Accel-1.jpg)


Download the medial app to read full posts, comements and news.