
Back
Anonymous
Hey I am on Medial • 1y
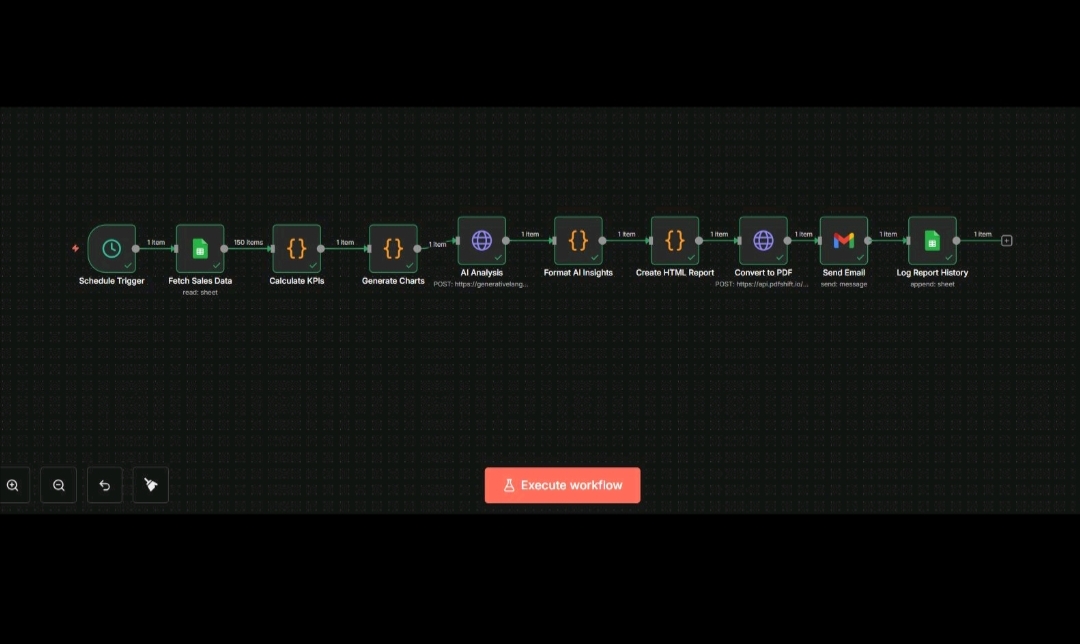
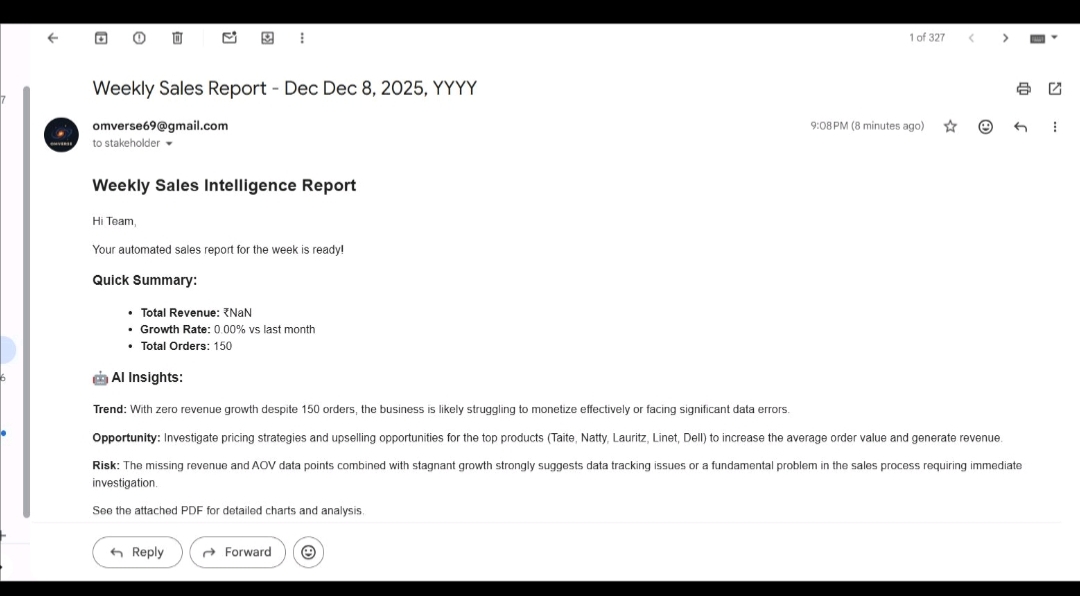
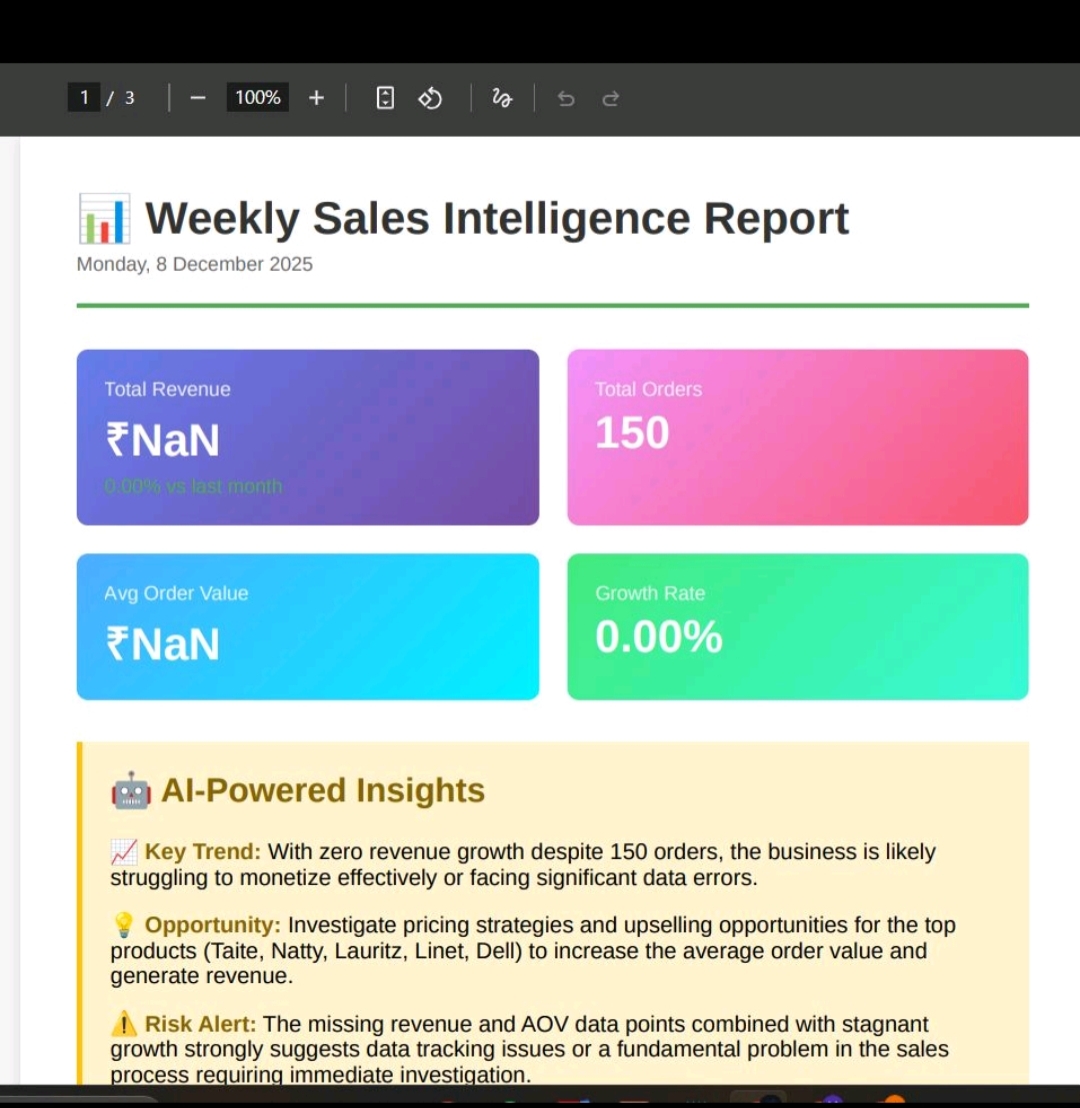
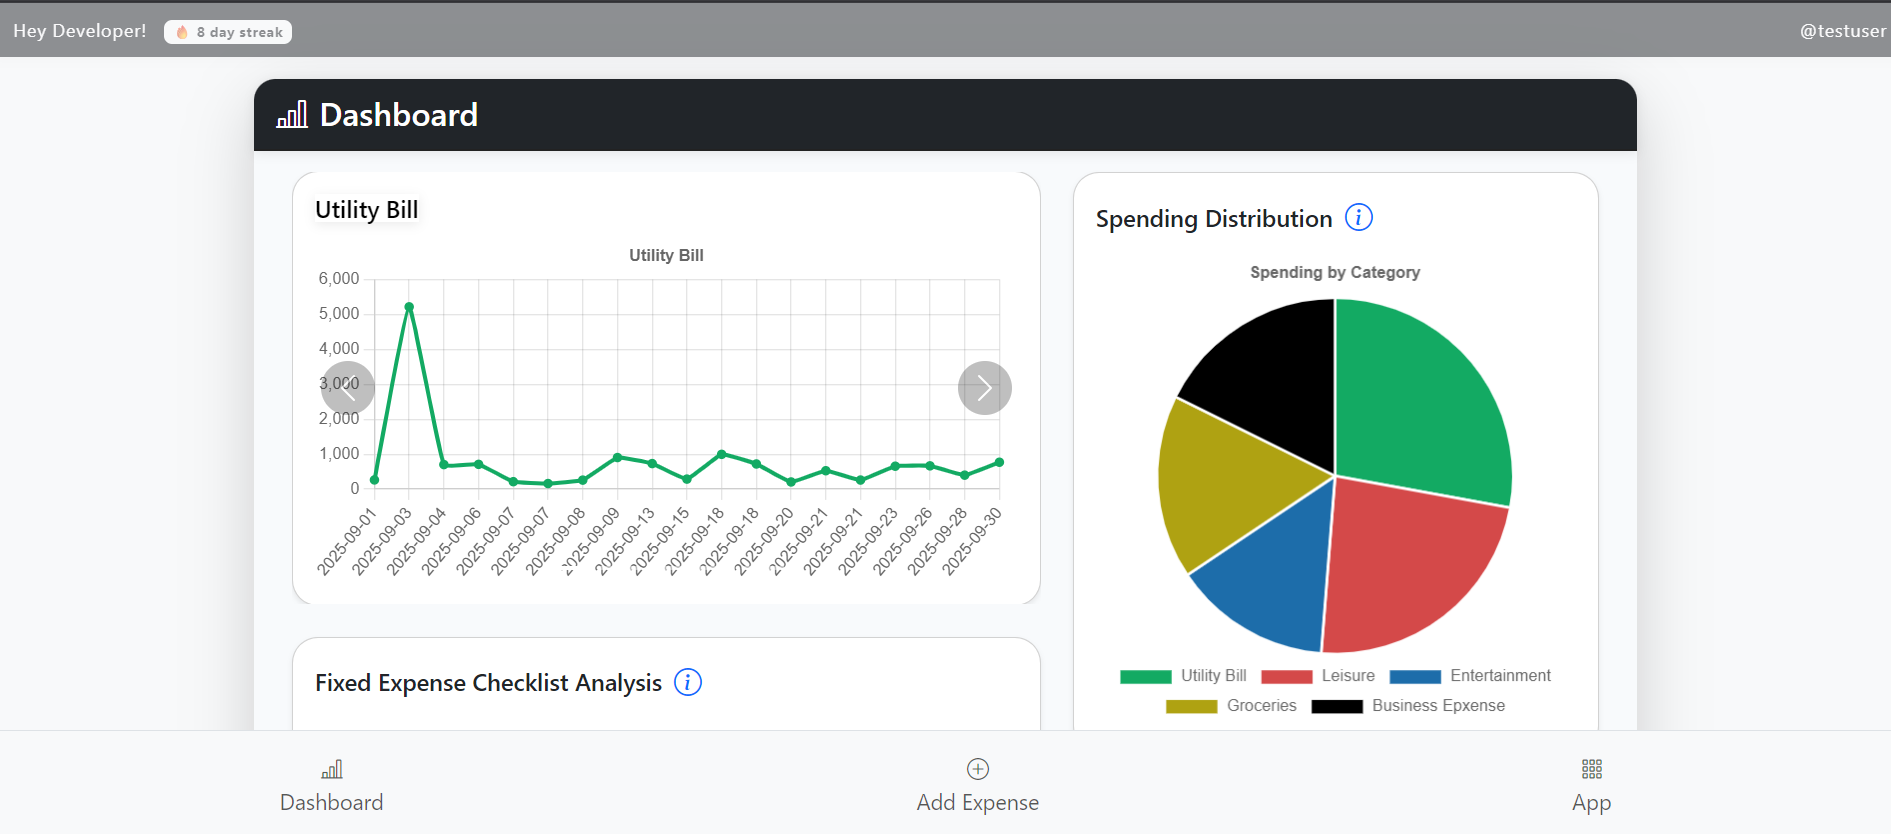
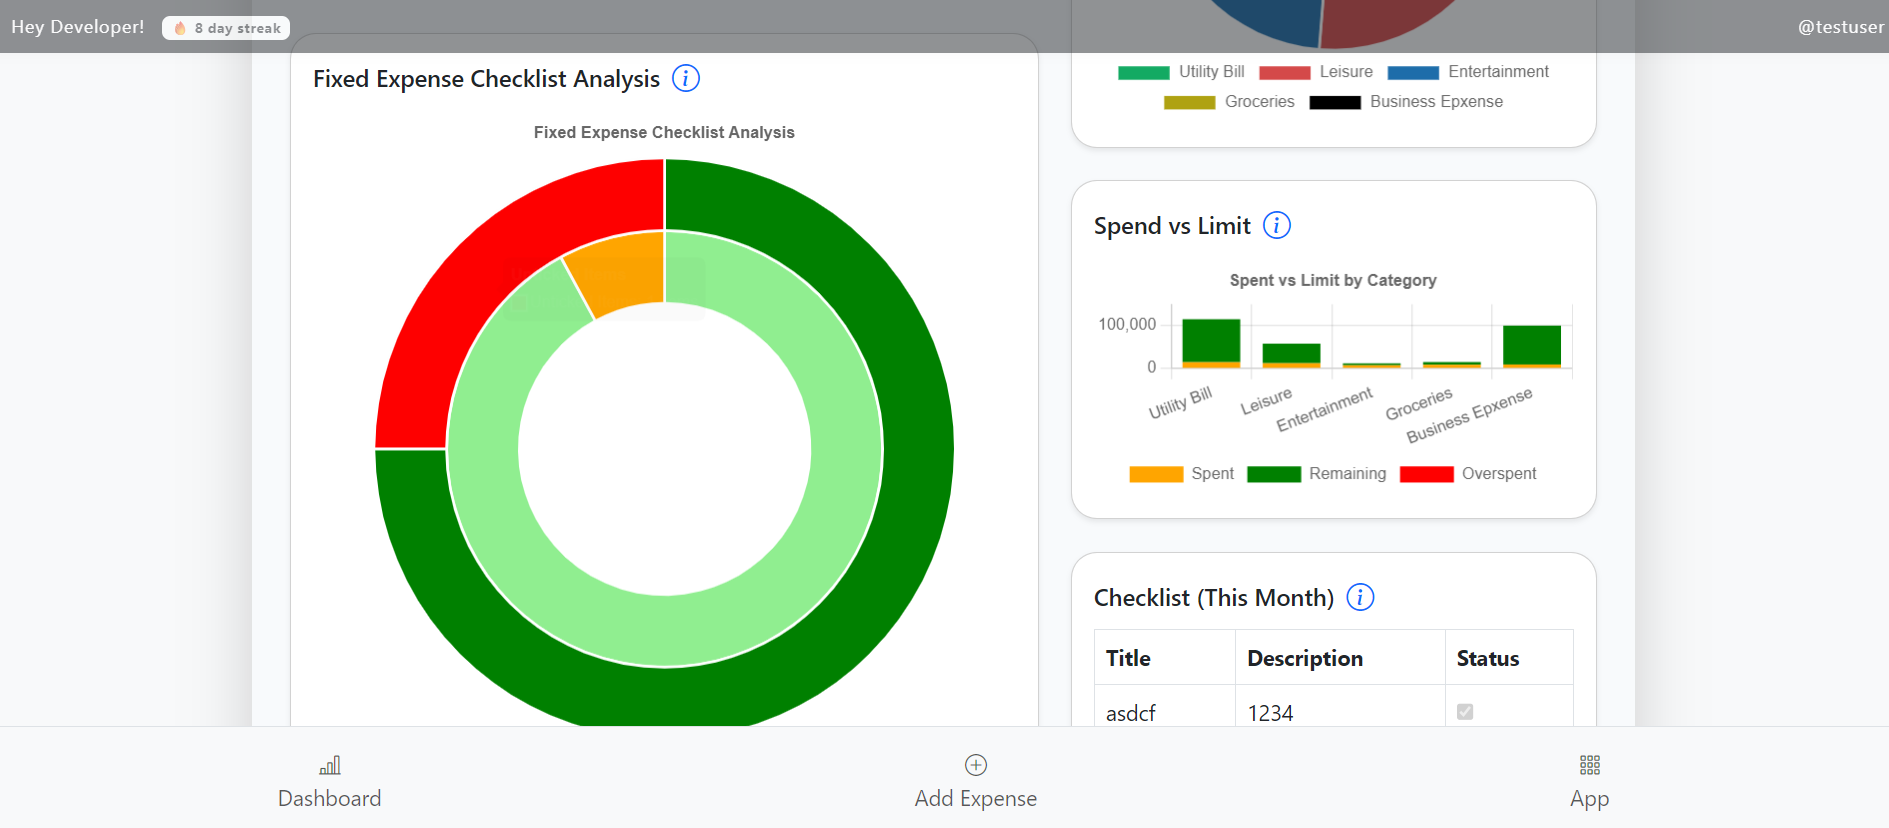
I want to build a saas product for data analysis for the manager and admins of the company... The workflow will be like that 1. Register to the platform 2. Connect their db 3. List of charts will be shown 4. People will select the chart 5. Now they have to provide the table/collection name the db from where they want to get the data 6. Then they will write the query fir that 7. Then they will write a post process code that will generate the data config for them 8. This config will be pass to the charts 9. Now we will support a webcomponet so that they can use it anywhere 10. Or they can create their own dashboard to use this generated chart from our system Now create a tech stack with proper guidance so that I can launch it is it good idea?
Replies (5)

More like this
Recommendations from Medial


Rohan Saha
Founder - Burn Inves... • 9m
I keep seeing articles saying that silver is in a great technical spot and could go up along with lots of other positive predictions. But honestly when I check the charts myself I don’t see anything special the RSI is already in the overbought zone o
See More

Vedant Patel
Hammer it until you ... • 7m
Hii I am building a ai tool which interprets and make data visualization chart/ dashboard for better understanding of data and provide key data metrics I am seeking validation and does that idea make sense. As this will not only save time for dat
See More


Account Deleted
Hey I am on Medial • 8m
YouTube’s killing off the “Trending” tab starting July 21, 2025 What that means: – The main Trending page and “Trending Now” list are going away – Instead, YouTube Charts will highlight what’s hot in categories like music, gaming, trailers, and po
See More

Sudarshan Pal
Data Engineer @Quant... • 1y
Many argue that Data Engineering is a part of data science and analytics. It's different from data science, but they work together closely. Data Engineers come first in the process. They gather and organize data. This data is then used by Data Scien
See More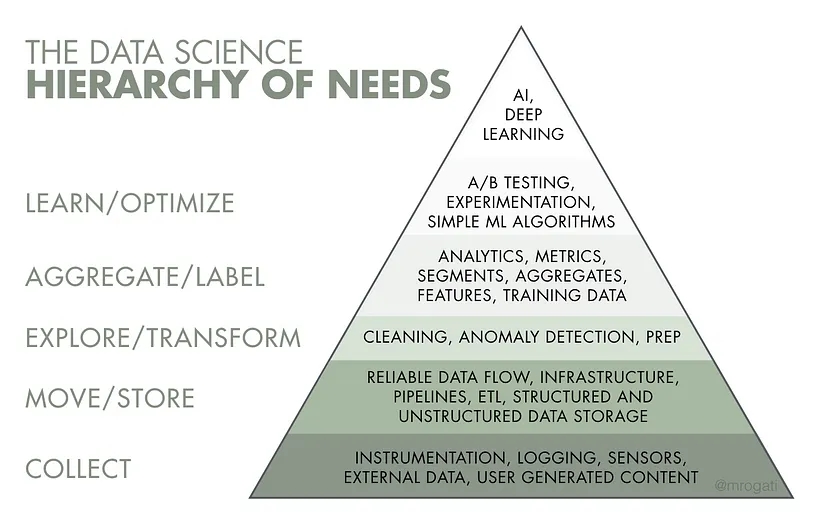


/entrackr/media/post_attachments/wp-content/uploads/2021/08/Accel-1.jpg)


Download the medial app to read full posts, comements and news.