Back
Anup Thatal
IT enthusiastic | Fu... • 6m
Basic of Statistics for data science Statistics is one of the most crucial subjects for the students. It has various methods that are helpful to solve the most complex problems of real life. Statistics is almost everywhere. Data science and data analysts use it to have a look on the meaningful trends in the world. Besides, statistics has the power to drive meaningful insight from the data. Statistics offers a variety of functions, principles, and algorithms. That is helpful to analyze raw data, build a Statistical Model and infer or predict the result. Terminologies in Statistics Before getting started with data science; we have to be well aware of the key statistical terminologies. The population: It is the set of the given sources from which the data has to be collected. There can be a huge number of population. Sample: It is the subset of data that is extracted from the given Population. Variable: It is the characteristics, number, or quantity of the data that can be measured or counted. In other words the variable is the data item. statistical model: The statistical model is also known as statistical Parameter or population parameter. Types of Analysis Statistics has two types of analysis.I Quantitative Analysis: Quantitative Analysis is also known as statistical analysis. It is the science or an art of collecting and interpreting data with numbers and graphs. We also use it to identify patterns and trends. Qualitative Analysis: Qualitative is also known as Non-Statistical Analysis. It gives generic information. It also uses text, sound and other forms of media. Data Types Numerical: Numerical data types are those data types which are expressed with digits. These data types are measurable. There are two major types of data types i.e. discrete and continuous. Categorical: Categorical data types are qualitative data and it is classified into categories. There are two types of major categorical data types i.e. nominal (no order) or ordinal (ordered data). Measures of Central Tendency Mean: Means stands for the average of the given dataset. Median: Median is the middle of the given ordered dataset. Mode: Mode is the most common value in a given dataset. It is the only relevant for discrete data. Measures of Variability Range: Range is the difference between the maximum and minimum value in a given dataset. Variance (σ2): Variance measures how spread out a set of the given data is relative to the mean. Standard Deviation (σ): It is also a measurement of how spread out numbers are in the given data set. Square root of variance is also known as standard deviation. Z-score: Z score determines the number of standard deviations a data point is from the mean. R-Squared: R square is a statistical measure of fit. It used to indicate how much variation of a dependent variable is explained by the independent variable(s). We can use it only for the simple linear regression. Adjusted R-squared: It is similar to the R squared and also R square modified version. It has been adjusted for the number of predictors in the model. It decreases if the old term improves the model more than would be expected by chance and vice versa. Measurements of Relationships between Variables Covariance: If we want to find the difference between two variables then we use the covariance. It is based on the philosophy that if it is positive then they tend to move in the same direction. Or if it’s negative then they tend to move in opposite directions. There will also be no relation with each other, if they are zero. Correlation: Correlation is all about to measure the strength of a relationship between two different variables. It ranges from -1 to 1. It is the normalized version of co-variance. Most of the time the correlation of +/- 0.7 represents a strong relationship between two different variables. On the other hand, there is no relationship between variables when the correlations between -0.3 and 0.3 Probability Distribution Functions Probability Density Function (PDF): It is for continuous data. Hereby in the continuous data the value at any point can be interpreted as providing a relative likelihood. In addition, the value of the random variable will also be equal to that sample. Probability Mass Function (PMF): In the probability mass function for a discrete data. It also gives the probability of a given occurring value. Cumulative Density Function (CDF): The cumulative density function is used to tell us the probability that the random variable is less than a certain value. In addition is also the integral of the PDF.
More like this
Recommendations from Medial
Sanskar
Keen Learner and Exp... • 3m
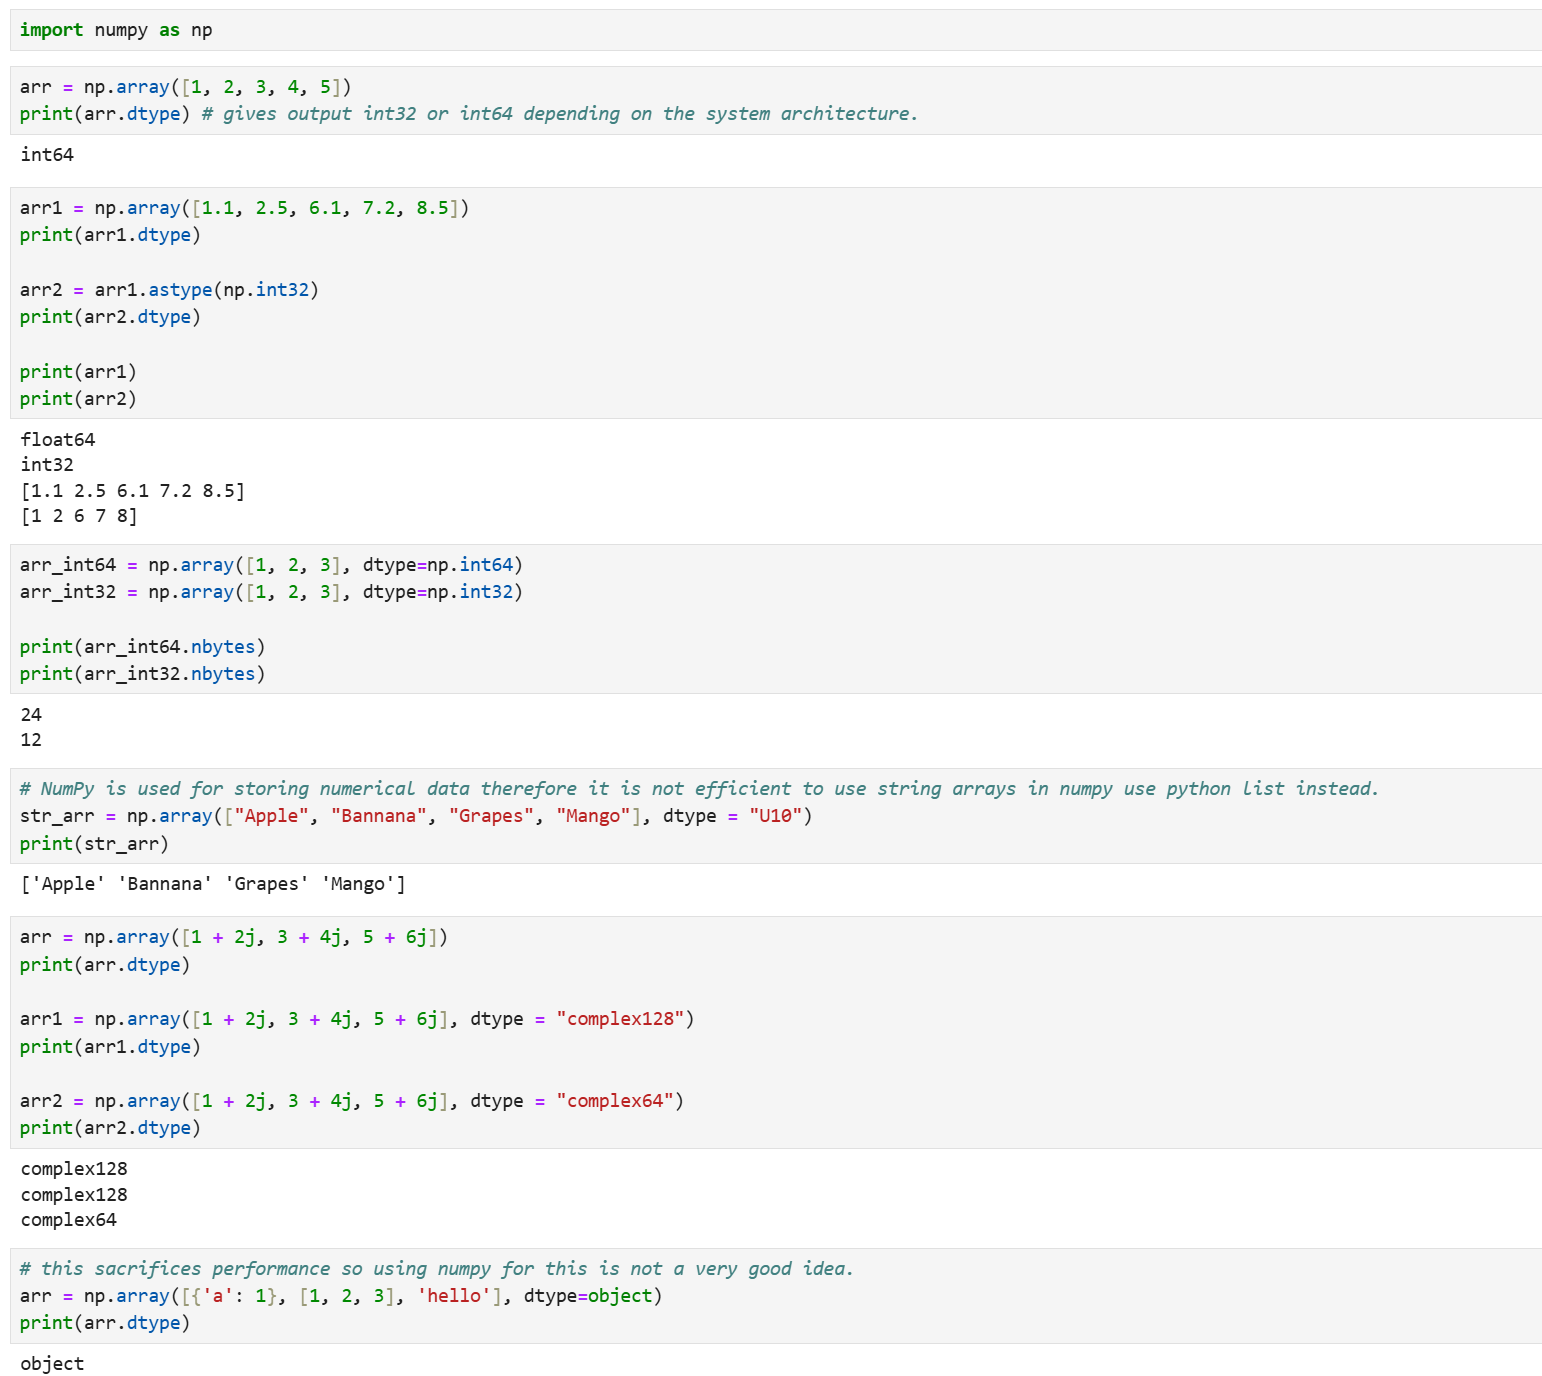
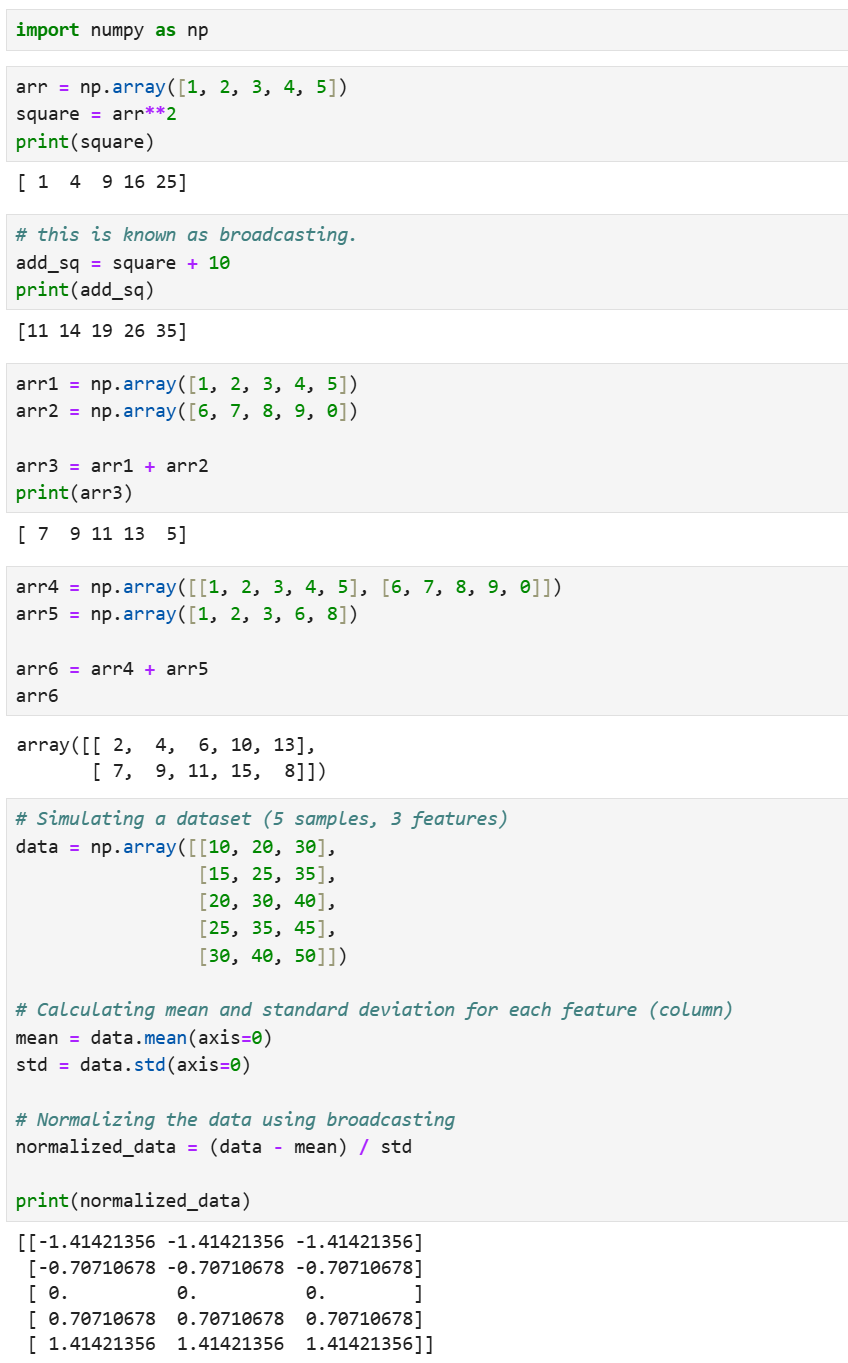
Day 9 of learning Data Science as a beginner. Topic: Data Types & Broadcasting NumPy offers various data types for a variety of things for example if you want to store numerical data it will be stored in int32 or int64 (depending on your system's a
See More

Suman solopreneur
Exploring peace of m... • 6m
BASIC MATH I think basic mathematics is really underrated. If you’re going to make money, if you’re going to invest money, your basic math should be really good. You don’t need to learn geometry, trigonometry, calculus, or any of the complicat
See MoreDownload the medial app to read full posts, comements and news.


