
Back

Sanskar
Keen Learner and Exp... • 3d
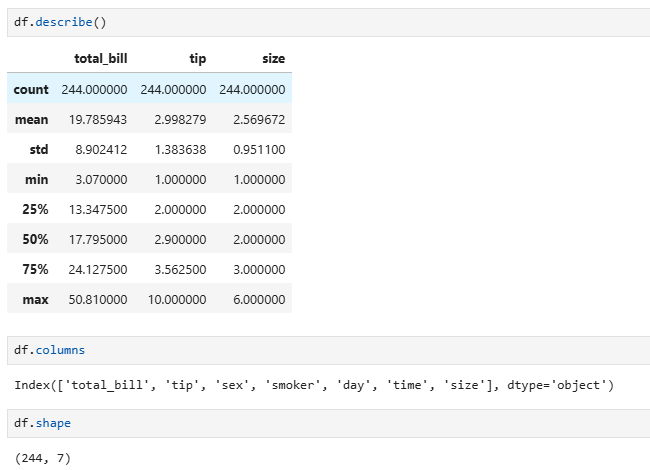
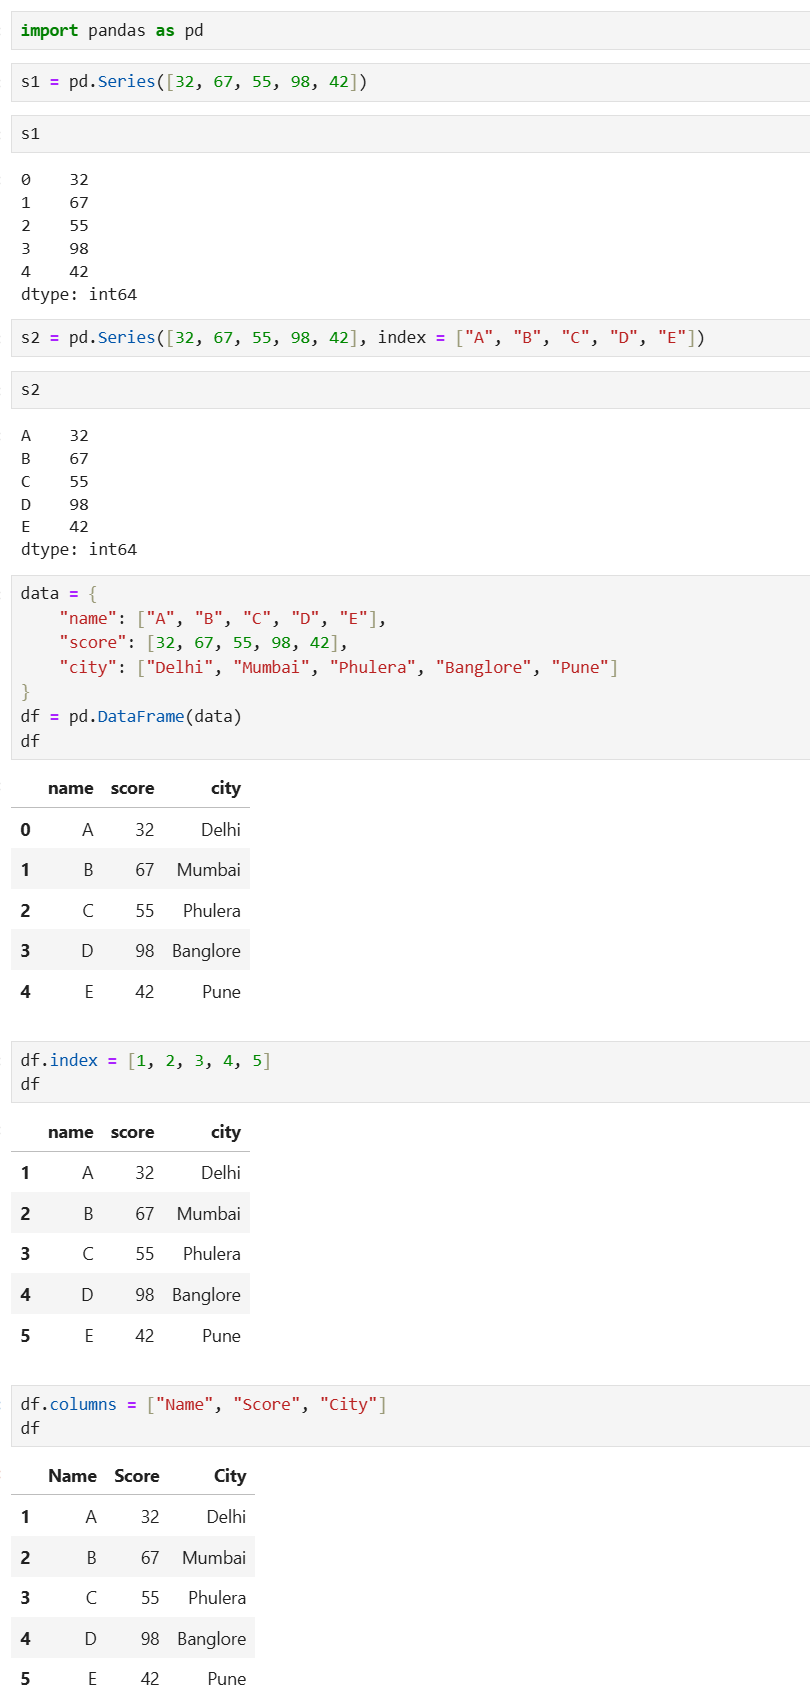
Day 16 of learning Data Science as a beginner. Topic: plotting graphs using matplotlib matplotlib is a the most fundamental plotting library in Python we typically use matplotlib.pyplot module in python you can understand it as the paintbrush which will draw the visualisation of our data we usually abbreviate this as plt. One of the many reasons for using matplotlib is it is really easy to use and is more readable. Plt involves many functions which we use in order to plot our graph. 1. plt.plot: this will create a line graph representation of our data. 2. plt.xlabel: this is used to give name to our x axis 3. plt.ylabel: this is used to give name to our y axis 4. plt.legend: this will also show legends in our graphical representation of our data 5. plt.title: this will give your graph a name i.e. a title 6. plt.show: this will open a new screen with the representation of your graph (works only on normal python script compiler and not on notebooks) There is also something called as format strings which you can use to decorate and make your graph more engaging to your audience. Matplotlib also offers various types of styles which you can use to alter the styles of your graphs. You can also view available styles which matplotlib offers using plt.style.available function. Also here's my code and its result.
More like this
Recommendations from Medial


Tenacious Cheetah
Hey I am on Medial • 4m
Hi Everyone! if is looking for project. Please DM me! Salary Depends on experience. What We're Looking For: • 5+ years of industry experience applying machine learning methods (user modeling, personalization, recommender systems, search, ranking, na
See More


Download the medial app to read full posts, comements and news.